
Legal Categories Card Sort Study

Study Plan
As usual, I start every study by writing a plan. Each plan details the approach, as card sorting can be done in a few different ways. It’s also where I define participant criteria, create my recruitment strategy and articulate the details of the content.
This study was done for the team building a new mobile app in which customers could request a consultation with a lawyer. Our system organizes consultations and assigns attorneys based on the area of law the customer needs help with. To help customers accurately identify their area of law and get to a lawyer able to consult them, we wanted to understand their mental schema for categories and groupings of issues within the concept of “law.”
Writing up a plan also gives the team a tactile record of our collective decision making. We all need to be on the same page about the purpose of the study, expected outcomes, content and meaningful metrics. If Legal needs to review and approve the study, as is common with any customer-facing interaction, this is what I’ll send, along with a link previewing the exercise in Optimal Workshop.
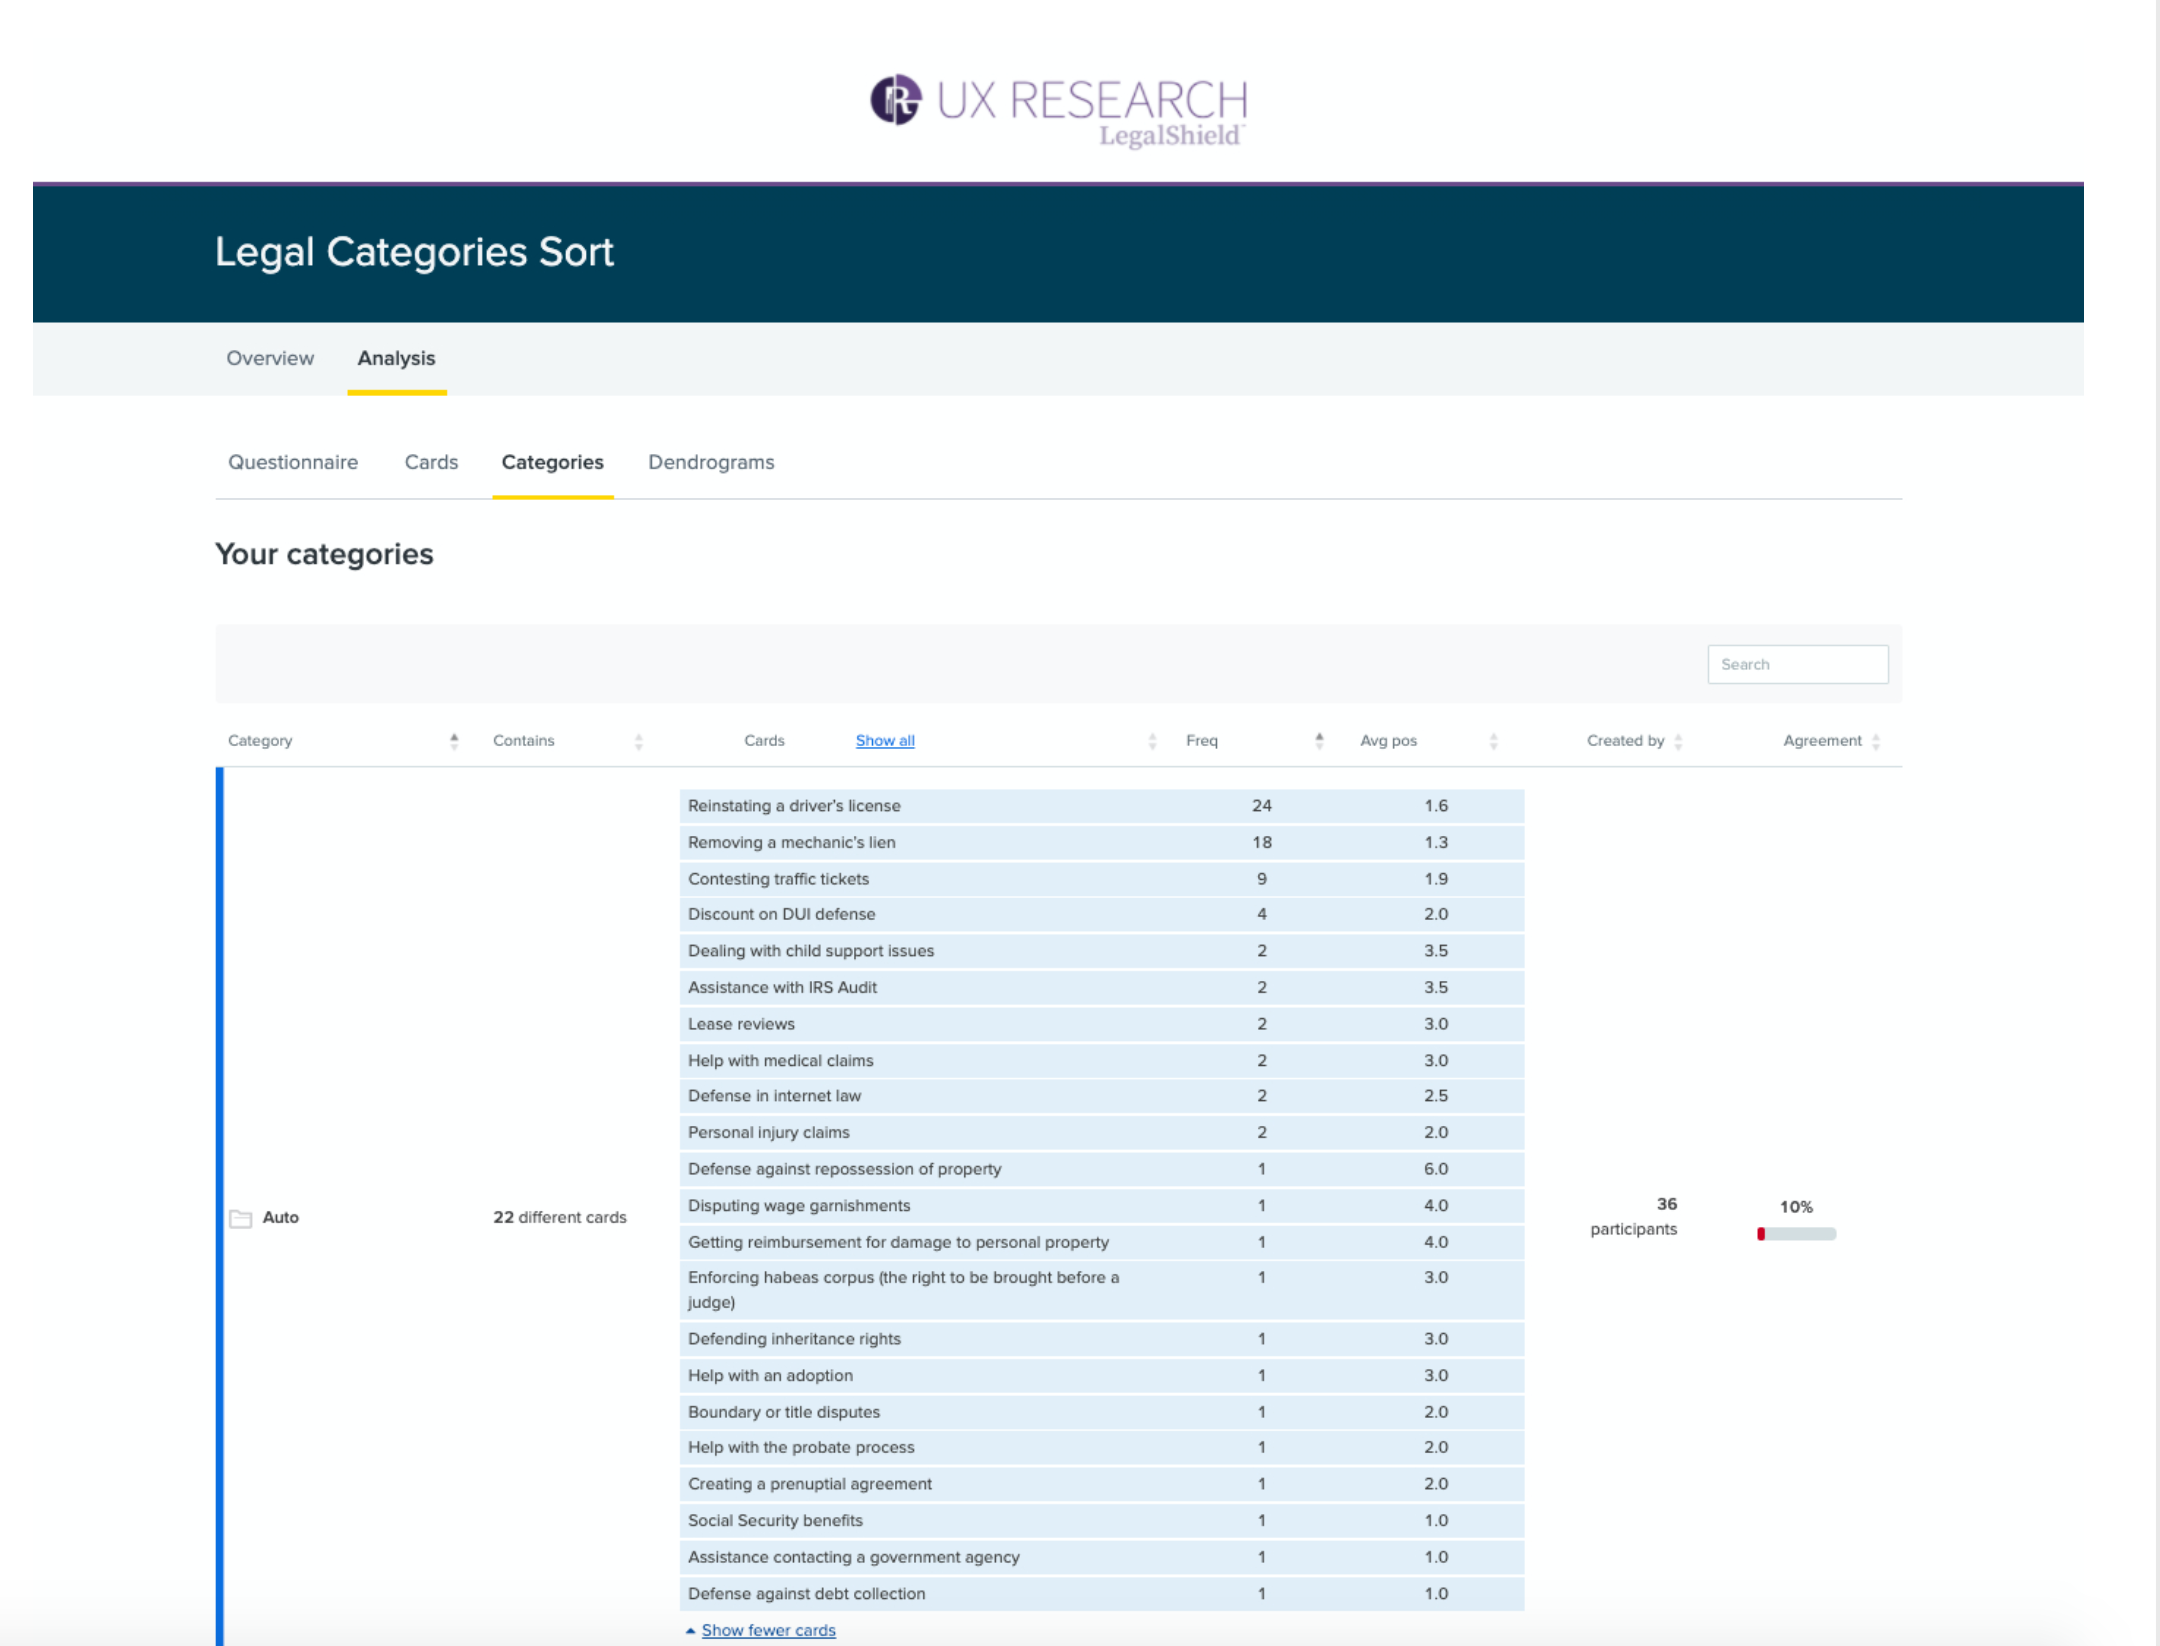
Results & Report
This shows several examples of the kind of data produced by a card sort study. When the team has access to a tool like Optimal Workshop, what would normally be a time-consuming process of days organizing and analyzing data becomes one that can be done in the span of hours.
I often describe my process as one of “marinating” in the data. I’ll spend time going through the results like these visuals with and without filters, comparing data in different formats. I use an Excel spreadsheet to organize my insights and various data points I want to put into the report as I go. Having a pre-defined template for the report helps me get the first few paragraphs written. From there, the data usually writes the report for me.
This study revealed that the average customer makes very little distinction among different areas of law. The data was extremely inconsistent, though a few specialties did arise as more commonly identified. This information, along with terms suggested by them to a question in the follow-up survey, helped us define nomenclature and broad categories to group the legal issues we cover.


Customer Priorities Card Sort Study
It’s difficult to know where to begin when attempting to make a UI that makes sense of something as overwhelmingly complex as the legal industry. I tend to agree with the mindset outlined by Gerry McGovern that the most practical approach to thinking about an application, one that doesn’t sacrifice a user-centered mindset but allows for action when you know very little, is to think about the “top tasks” a customer does using your software.
To execute a study similar to the method he developed using tools we already had, I set up a card sorting study wherein I asked current paying Members to sort legal services by categories of pre-defined priority. This gave us a significant amount of information about customers’ priorities, as well as solid foundational hypotheses to guide further research and eventual persona development. The priorities customers have for their legal services tells us what tasks are most important to prioritize with our feature development. The deeper read on which priorities are ranked highly begins to give us clues regarding the purpose and emotional connection our service has in their lives.
Study Design & Deliverables


Several steps were involved to complete this process. Here I share documents showing how I went about executing this study:
I began with a plan outlining the goals, objectives and methods.
Our email marketing specialist, the one person who has a dependable line of communication with our customers, helped define our recruitment strategy and the number of customers to contact.
Next, our data scientists helped pull the information I needed for Members meeting my study criteria.
I worked with Accounting and Legal to set up an incentive for Members’ participation in the exercise and to clear all legal concerns.
I wrote a recruitment email, which the Email Marketing Manager sent out to nearly 15,000 people.
Of that initial group, we had 192 participants complete the exercise, which was sufficient data for the data to be considered significant, including for some of the demographic segments.
This gave me a massive spreadsheet of raw data. My data scientist buddy consulted on cleaning that data into a sheet wherein I have several pivot tables set up to generate stacked bar graphs based on various criteria.
From here, I wrote a comprehensive report with detailed analysis of the data, including a foundation for understanding common mental schemas of our Member base.
This study was also completed with internal stakeholders, which allows us to compare our own assumptions with actual customer data.

Sharing the Results
I took the opportunity to share this information in an online lunch-and-learn webinar. The presentation aimed at both communicating results and educating the audience about the UX mindset and methods behind it. I also broke down how this data tells us something different from the data the company has historically used to derive understanding of what our customers want.
To get at action steps based on the data, I facilitated a meeting for an in-depth review of the report with the Product Owner, UX Designer and VP Engineer. We pulled out some big questions to help guide our research planning and app priorities into this year, including ideas for deeper data dives.